AvalonBay Communities, Inc.
CEO : Mr. Benjamin W. Schall
Quarterly earnings growth(YoY,%)
| Period | Revenue | Operating Income | EPS | Release Date |
|---|---|---|---|---|
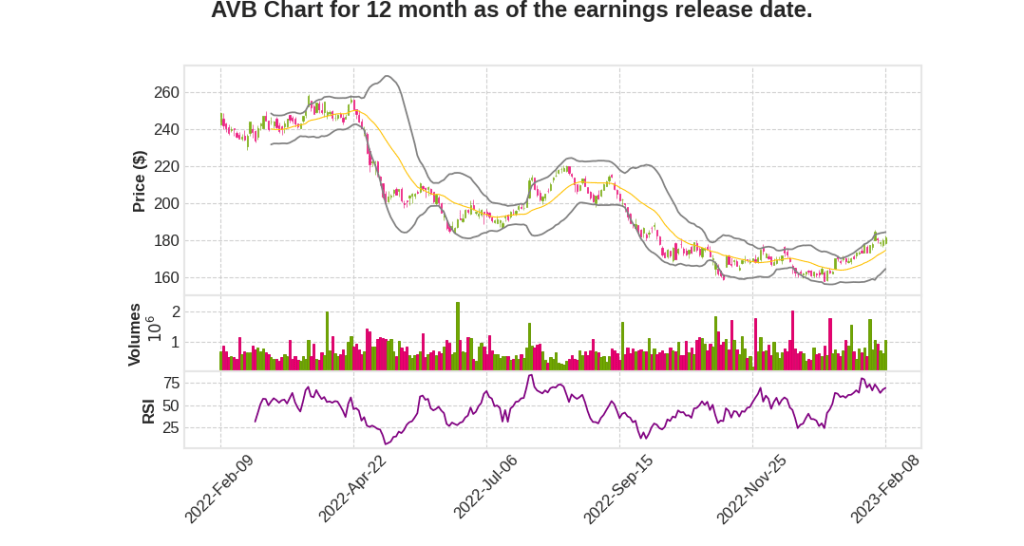
| 2022 Q4 | 11.4% YoY | 11.0% | -28.3% | 2023-02-09 |
Sean Breslin says,
Operating Environment Overview
- Occupancy, availability, and turnover trending to normal levels
- Rent seasonality returned with peak values achieved during Q2 and Q3
- Volume of prospective renters increased in January, translating into modest lift in occupancy
- Asking rents increased about 100 basis points since the beginning of the year
Outlook and Revenue Growth
- Midpoint of outlook reflects same-store revenue growth of 5% for full year 2023
- Growth in lease rates is driving majority of revenue growth (3.5% embedded growth from 2022 and an expectation of roughly 3% effective rent growth for 2023)
- Additional contributions from other rental revenue, projected to grow by roughly 16%
- East Coast regions to produce revenue growth slightly above the portfolio average, while West Coast markets projected to fall below the portfolio average
Operating Expense Growth
- Same-store operating expense growth projected to be elevated in 2023 due to underlying inflation in macro environment
- Greater pressure on insurance rates expected
- Phaseout of property tax abatement programs projected to add about 70 basis points to total operating expense growth for the year
- Initiatives adding about 150 basis points to OpEx growth for the full year, with Avalon Connect expected to deliver about $5 million in 2023
Uncollectible Lease Revenue and Net Bad Debt
- Uncollectible lease revenue expected to improve from 3.7% in 2022 to 2.8% in 2023
- Projected $36 million reduction in amount of rent relief expected to recognize in 2023
- Combination of two reflects projected 80 basis-point headwind from net bad debt for full year 2023
Regional Impact of Rent Relief Change
- Reduction in rent relief will have more material impact on reported 2023 revenue growth in certain regions and markets, such as Southern California and Los Angeles
Matt Birenbaum says,
Development as a Driver of Earnings
- $2.4 billion in development underway with a projected yield of 5.8%.
- Conservative underwriting does not include mark-to-market rents.
- 4 out of 18 projects reflect the mark-to-market rents, generating rents $395 per month above pro forma.
- Expect similar lift at many of the 14 other deals as they open for leasing over the next two years.
Development Starts and Yield Target
- Expect roughly $900 million in development starts this year across 7 different projects with roughly half in new expansion regions.
- Targeting yields at 100 to 150 basis-point spread over prevailing cap rates.
- Majority of the start activity in the second half of the year.
- Hopeful to take advantage of moderating hard costs across markets as budgets are finalized.
Book of Future Opportunities
- Increased development rights pipeline to roughly 40 individual projects, balanced between coastal regions and new expansion regions.
- Control pipeline with a modest investment of just $240 million.
- Tremendous leverage on investment in future business.
Capital Allocation
- Disciplined in capital allocation.
- Projected start activity could vary significantly from current expectations depending on how interest rates, asset values, and construction costs evolve over the year.
Closing Remarks
- No closing remarks mentioned in the transcript.
Q & A sessions,
Lease Rent Upside and Downside
- Macroeconomic assumptions reflected in models could impact lease rent side
- Decelerating macro environment in late 2022 could impact 2024 more than 2023
- Bad debt is challenging to forecast; starting the year with 3.1% underlying bad debt, expected to get down to about 2.3% by year-end
- Improvement pace expected to be more in second half than first half due to issues in LA and sluggishness in courts in Northeast
Impact of Tech Market on Regions
- Sluggishness in tech markets in Northern California and Seattle
- Mid-Atlantic impacted by government not being back in the office
- New York City, Boston, and Southern California seeing strong performance
- More risk on tech side of things in terms of deceleration, but some stabilizers in other regions
Performance of Urban vs. Suburban Markets
- Urban assets recovering but suburban assets saw stronger growth with a blended rent change of 5% in Q4; 4.5% in suburban portfolio and just above 6% in urban portfolio
- Suburban submarkets have always been challenging for development; urban development opportunities may overcorrect and be more selective than in the last cycle
Capital Rotation and Cap Rate Spread
- Expect to see continued asset sales out of the Northeast, selectively out of the West Coast, and some out of Boston and Mid-Atlantic regions
- Cap rate spread may have tightened some over the last year or two
- Tactically shifted to sell first then buy to inform view of how much to pay on buy side
Impact of Hard Costs and Rents on Construction
- Hard costs moderating more than rents
- Starting to see savings on buyout and growth in pricing slowing on a couple of projects started in Q3 and Q4
- Hard costs expected to be lower in many regions looking to start business in over the next year compared to Q3, Q4 of last year