CarMax, Inc.
CEO : Mr. William D. Nash
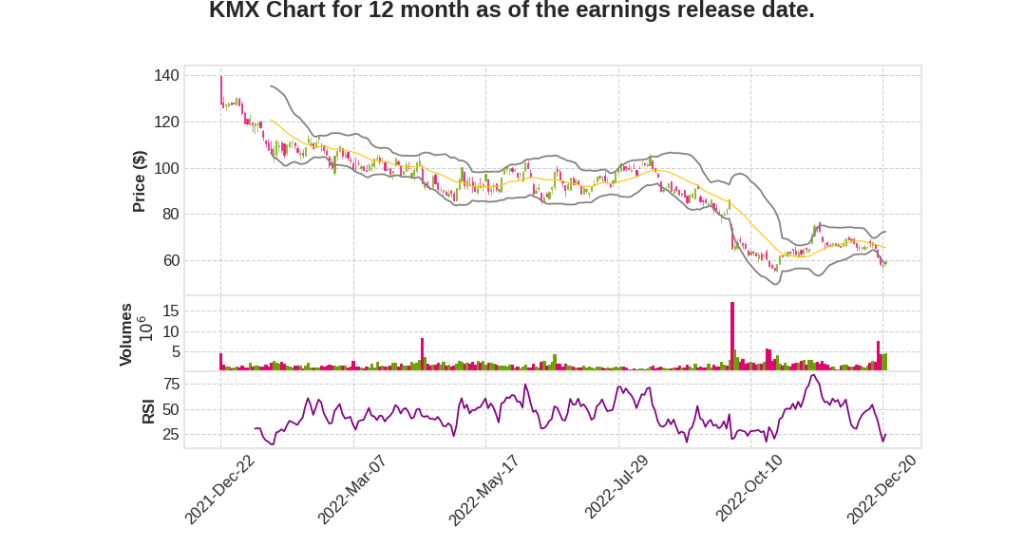
Quarterly earnings growth(YoY,%)
| Period | Revenue | Operating Income | EPS | Release Date |
|---|---|---|---|---|
| 2023 Q3 | -23.7% YoY | -113.1% | -85.5% | 2022-12-22 |
Bill Nash says,
Macro factors impacting the industry
- The used car industry is facing widespread pressures due to macro factors such as broad inflation, climbing interest rates, and continued low consumer confidence.
- Persistent and steep depreciation impacted wholesale values throughout the quarter.
Actions taken by the company
- The company has been taking deliberate steps to support its business for both the short-term and the long run.
- Actions taken during the quarter include further reducing SG&A, selling a higher mix of older lower priced vehicles, slowing buys in light of the steep market depreciation, maintaining used saleable inventory units while driving down total inventory dollars more than 25% year-over-year.
- Raising caps consumer rates to help offset rising cost of funds, pausing share buyback to give us capital flexibility and slowing planned store growth for next fiscal year to five locations while maintaining our ability to open more locations if market conditions change.
Third quarter financial performance
- Total sales for the third quarter of FY 23 were $6.5 billion, down 24% compared with last year’s third quarter driven by lower retail and wholesale volume.
- Total unit sales in the third quarter declined 20.8% and used unit comps were down 22.4% versus the third quarter last year.
- Retail gross profit per used units was $2,237, which is consistent with last year’s third quarter.
- Unit sales were down 36.7% versus the third quarter last year, driven by rapidly changing market conditions.
- Gross profit per unit was $966, down from a third quarter record of $1,131 a year ago.
- The company bought approximately 238,000 vehicles from consumers and dealers during the third quarter, down 40% versus last year’s period.
Enrique Mayor-Mora says,
Third quarter financial results
- Net earnings per diluted share was $0.24, down from $1.63 a year ago.
- Total gross profit was $577 million, down 31% from last year’s third quarter.
- Used retail margin of $403 million and wholesale vehicle margin of $115 million declined 21% and 46% respectively.
- Other gross profit was $59 million, down 49% from last year’s third quarter, driven primarily by lower retail unit sales on service and EPP.
- SG&A expenses for the third quarter were $592 million, up 3% from the prior year’s quarter.
Expenses and capital structure
- SG&A as a percent of gross profit was materially pressured, due primarily to the 31% decrease in total gross margin dollars compared to last year’s quarter.
- During the quarter, the company took steps to better align expenses to sales, including reducing staffing through attrition, limiting hiring and contractor utilization, and aligning marketing spend to sales.
- The company is taking a conservative approach to its capital structure amid continued market uncertainties, pausing share buybacks and slowing the velocity of its CapEx spend.
- Liquidity remains strong, with over $680 million in cash on the balance sheet and no draw on the $2 billion revolver.
Q & A sessions,
Omni-Channel Experience Enhancements
- Enhancing online features for customers to complete transaction steps on their own, with assisted help if needed
- Express pickup option to complete transactions in-store in as little as 30 minutes to lower costs over time
- Seamless integration of finance-based shopping product into stores and customer experience centers, with added lenders
Operating Model Updates
- Self-check-in and enhanced e-sign functionality in business offices to reduce associate time spent per customer
- Improved digital customer queue and new software for title speed and visibility to shorten transaction times
Selective Key Project Investments
- Max Offer appraisal product update for dealers to provide a fully digital instant offer experience
- Leveraging technology to enhance logistics capability and drive efficiencies
- Upgrades to auction experience with modernized vehicle detail page, AI-enhanced condition reports, and proxy bidding
Impact of Soft Sales and Market Share Declines
- Softness in sales continued into October and November, with December running about where Q3 ran on average
- Market share gains year-to-date, with declines in September and October due to competitors lowering prices and margins to move inventory
Efforts to Reduce SG&A Expenses
- Significantly reduced SG&A growth from 16-17% year-over-year in H1 2023 to 3% growth in Q3 2023
- Lowering headcount and staffing through attrition in stores and actively managing fixed costs in corporate home office