Hilton Worldwide Holdings Inc.
CEO : Mr. Christopher J. Nassetta
Quarterly earnings growth(YoY,%)
| Period | Revenue | Operating Income | EPS | Release Date |
|---|---|---|---|---|
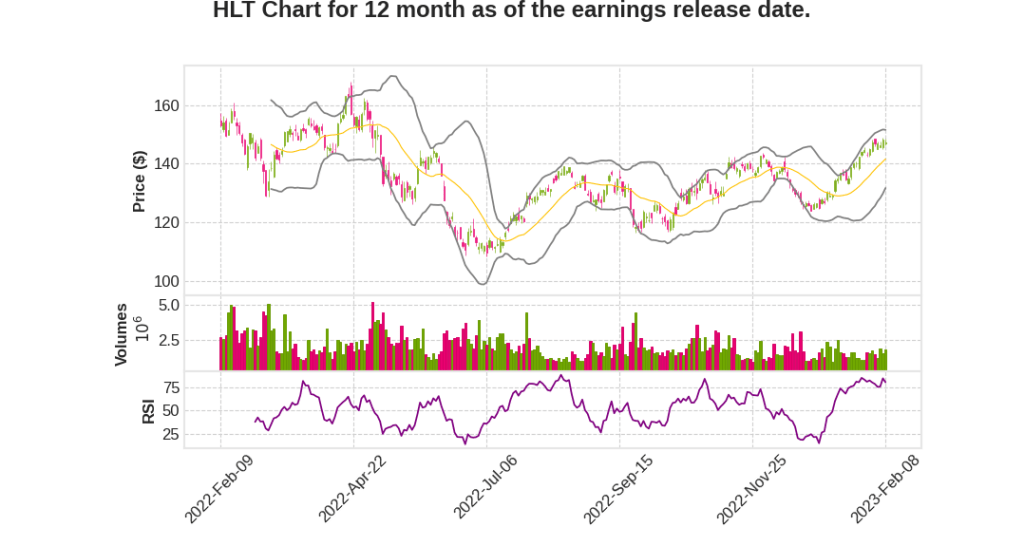
| 2022 Q4 | 33.1% YoY | 51.4% | 122.6% | 2023-02-09 |
Chris Nassetta says,
Strong Q4 2022 Results
- System-wide RevPAR up 24.8% YoY and 7.5% compared to 2019
- Adjusted EBITDA and EPS surpassing expectations and prior peaks with margins of roughly 69%, up more than 300 basis points YoY and more than 800 basis points over 2019 levels
- Strong results and higher margins enabled Hilton to generate the highest levels of free cash flow in their history and returned more than $1.7 billion to shareholders for the full year
Growth Across all Segments
- Continued growth in all segments and aided by easy first-quarter comps due to Omicron, meaningful recovery across Asia and solid growth in U.S. urban markets as group business continues to recover
- Group position is up 25% YoY and nearly back to 2019 levels with robust forward bookings and tentative bookings up more than 20% versus last year, helped by rising demand for company meetings as organizations bring their teams back together
- Small and medium-sized businesses remained an important and growing part of Hilton’s business travel segment, accounting for roughly 85% of their segment mix and enhancing the overall resiliency
Disciplined Development Strategy Enhancing Network Effect
- Added nearly a hotel a day, totaling more than 58,000 rooms for the full year
- Opened the 7,000th hotel, added 10 new brands to the system, and achieved all of this without any acquisitions
- Record pipeline of more than 416,000 rooms, half of which are under construction, with net unit growth of 5% to 5.5% for the year and confident in their ability to return to 6% to 7% net unit growth over the next couple of years
Newest Brand, Spark by Hilton, to Meet Needs of More Guests and Owners
- Launched Spark by Hilton, a value-driven product that delivers their signature reliable and friendly service at an accessible price
- Premium economy represents a large and growing segment of travelers, totaling nearly 70 million annually in the U.S. alone, for which Hilton has not had a tailored brand to serve
- More than 200 deals in various stages of negotiation, almost all of which are conversions from third parties, and identified more than 100 U.S. markets with no Hilton-branded products
Hilton Honors Program and Positive Impact on Communities
- Hilton Honors surpassed 150 million members during the fourth quarter and remains the fastest-growing hotel loyalty program
- Honors members accounted for approximately 64% of occupancy in the quarter, up more than 300 basis points year-over-year and roughly in line with 2019
- Hilton was included on both the World and North America Dow Jones Sustainability Indices for the sixth consecutive year, the most prestigious ranking for corporate sustainability performance
- Hilton was ranked among the World’s Best Places to Work by Fortune and Great Place to Work for the seventh consecutive year
Kevin Jacobs says,
RevPAR Growth and Financial Performance
- System-wide RevPAR grew by 24.8% YoY on a comparable and currency neutral basis and increased 7.5% compared to 2019.
- Adjusted EBITDA was $740 million in Q4 2022, up 45% YoY and exceeding the high end of the guidance range.
- Management and franchise fees grew 31% YoY, driven by continued RevPAR improvement.
- Diluted earnings per share adjusted for special items was $1.59, increasing 121% YoY and exceeding the high end of the guidance range.
Regional Performance
- Q4 2022 comparable U.S. RevPAR grew 20% YoY and increased 8% versus 2019, with all three segments showing improvement as compared to 2019.
- Fourth quarter RevPAR outside of the U.S. grew significantly YoY, with Europe leading with 67% YoY growth, driven by continued strength in leisure demand and recovery in international inbound travel.
- In the Asia Pacific region, Q4 2022 RevPAR was up 29% YoY, but China saw a 37% decline in RevPAR compared to 2019 due to a surge in new COVID cases.
Development and Unit Growth
- Net unit growth for the full year was 4.7%, modestly lower than expected due to the ongoing COVID environment in China, which weighed on fourth quarter openings.
- For full year 2023, the company expects net unit growth of between 5% and 5.5%.
- The company’s pipeline grew year-over-year, ending 2022 at more than 416,000 rooms, with nearly 60% of those located outside the U.S. and roughly half under construction.
Guidance
- For Q1 2023, the company expects system-wide RevPAR growth to be between 23% and 27% YoY, adjusted EBITDA of between $590 million and $610 million, and diluted EPS adjusted for special items to be between $1.08 and $1.14.
- For full year 2023, the company expects RevPAR growth between 4% and 8%, adjusted EBITDA of between $2.8 billion and $2.9 billion, and diluted EPS adjusted for special items of between $5.42 and $5.68.
Capital Return
- The company returned more than $1.7 billion to shareholders in the form of buybacks and dividends for full year 2022.
- For full year 2023, the company expects to return between $1.7 billion and $2.1 billion to shareholders in the form of buybacks and dividends.
Q & A sessions,
Strong demand and supply constraints drive positive industry fundamentals
- Low levels of supply in US market
- No signs of weakening demand
- Continued shift towards spending on experiences
- International markets are opening up, particularly in Asia Pacific
- Pent-up demand across all segments
Expectation of moderate recession in the second half of 2022
- Anticipated plateauing of occupancy rates
- RevPAR levels expected to remain higher due to rate integrity and pricing power
- Assumption of flattening or modestly lower pricing power in second half of year
- Soft to bumpy landing in US market
Spark brand expected to be a major disruptor in market
- Engineered to provide high-quality, consistent experience at lower price point
- Expected to be largest brand in terms of number of units
- Opportunity to acquire new customers and be worth billions to shareholders
Majority of pipeline has no financial support
- More than 90% of pipeline has no key money or financial support
- CapEx spending on pipeline is lower when key money is excluded