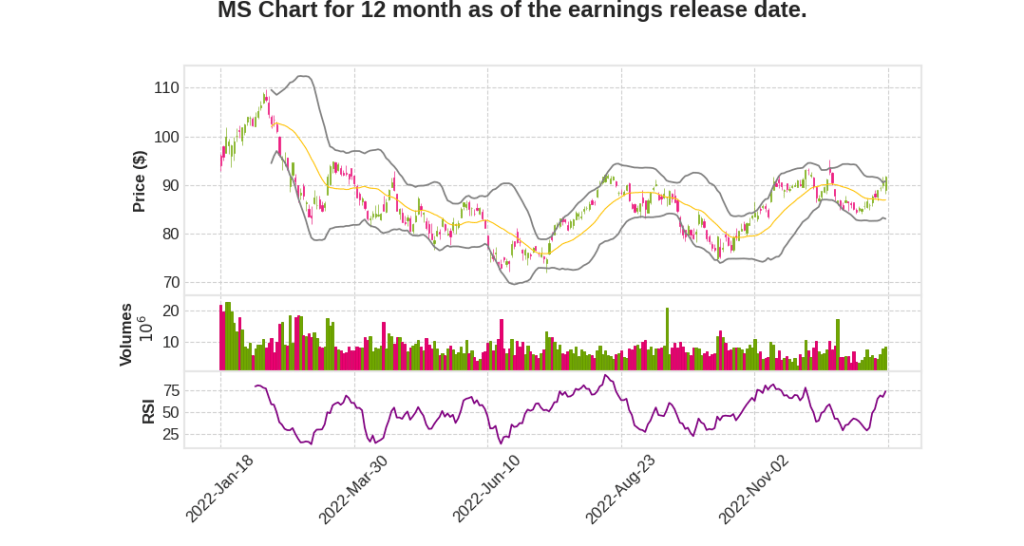
Morgan Stanley
CEO : Mr. James Patrick Gorman
Quarterly earnings growth(YoY,%)
| Period | Revenue | Operating Income | EPS | Release Date |
|---|---|---|---|---|
| 2022 Q4 | -13.2% YoY | 86.6% | -37.6% | 2023-01-17 |
James Gorman says,
Financial Performance
- Morgan Stanley demonstrated resilience and delivered on an ROTCE of 16%, including integration-related expenses from their deals, amidst combined impact of persistent inflation and rapid central bank tightening.
- Despite lower asset values and an anemic underwriting calendar, the firm generated a 16% ROTCE and the most excess risk-based capital of their peers and attracted over $300 billion of net new assets.
Wealth and Investment Management
- Wealth and Investment Management will become an increasingly larger portion of the firm’s pretax profit.
- Morgan Stanley’s growth strategy is centered around their client-centric franchise with a common objective to facilitate capital flows between those who have it and those who need it.
- Morgan Stanley has leadership positions across channels, reflecting their combination of best-in-class advice and technology, and the ability to meet any client wherever they are in their wealth accumulation journey. They aim to consolidate assets under their platform.
Institutional Securities
- Morgan Stanley’s institutional business remains a top three global leader in the industry, as demonstrated by a wallet share position, and has steadily rebuilt their fixed income franchise focused on their strongest capabilities.
- Morgan Stanley has demonstrated their ability to defend share and gain it in relatively more capital-light businesses. They have shown prudent several resources as illustrated clearly by the disciplined RWA usage and their consistent G-SIB surcharge of 3%.
Capital Strategy and Shareholder Return
- Morgan Stanley has 200 basis points of excess capital above their regulatory requirement, which enables them to continue to invest in their business for future growth and deliver robust returns to shareholders.
- Morgan Stanley delivered a 9% capital return to their shareholders last year and remain committed to ongoing shareholder return, adjusting always for regulatory requirements and business performance.
Net New Assets (NNA) Growth
- Over the last three years, Morgan Stanley’s platform generated nearly $1 trillion of net new assets showing a clear step change from prior periods and marking Morgan Stanley as a leader across their peer group as an asset accumulator.
- Morgan Stanley expects to drive approximately $1 trillion in net new assets over a three-year period. No single source is accounting for greater than 25% of this net new money, which is a combination of several things to fill the funnel of net new money.
Sharon Yeshaya says,
Financial Performance Highlights
- Full-year revenues of $53.7 billion and PBT of $14.1 billion; Fourth quarter contributed $12.7 billion in revenues and PBT of $2.8 billion.
- Wealth Management had a record year and Fixed Income had its strongest performance in over a decade.
- Full-year ROTCE was 15.3% and 15.7% excluding integration costs.
Business Segment Performance
- Institutional Securities full-year revenues declined 18% from the prior year, with weaker Investment Banking results.
- Equity full-year revenues were $10.8 billion, representing another strong year of over $10 billion.
- Fixed income revenues of $9 billion for the full year were the highest in over a decade.
- Wealth Management produced record revenues of $24.4 billion and a record pretax profit of $6.6 billion, resulting in a PBT margin of 27%.
- Investment Management reported full-year revenues of $5.4 billion, declining 14% from the prior year.
Integration-Related Expenses
- Expect to incur approximately $325 million of additional integration-related expenses in 2023, with approximately 2/3 related to E*TRADE and 1/3 related to Eaton Vance.
- This will be the last quarter we present measures that exclude integration-related expenses from reported results.
Expense Management and Efficiency Ratio
- Total expenses were approximately flat to the prior year. The full-year efficiency ratio was 73.2%, excluding integration-related expenses, 72.4%.
- Cognizant of the ongoing macro uncertainty, we continue to review efficiency opportunities.
Tax Rate and Share Repurchase Program
- The full-year tax rate was 20.7%, and we expect our 2023 tax rate to be approximately 23%.
- The firm executed its share repurchase program, repurchased approximately $1.7 billion of common stock in the quarter.
Q & A sessions,
Capital Strategy
- Reduced peak to trough in CCAR due to change in business mix
- Reduced RWAs in response to market environment
- Prudent approach to Basel III implementation
- Proven track record of capital distributions
Business Mix
- Fixed income call grows as share of business increases
- Equities core franchise back at number one
- Focus on Wealth and Investment Management businesses with durable fee-based revenues
Growth Strategy
- Client-centric franchise focused on facilitating capital flows
- Investment in core businesses with scale in major markets
- Significant competitive moat in each business
- Alignment with markets where the firm performs best
- Acquisition and integration of businesses aligned with core strategy
- Focus on Wealth and Investment Management for future growth
- 18 million relationships in Wealth Management, deepening and consolidating assets
Performance
- 16% ROTCE in challenging market environment
- Most excess risk-based capital of peers
- $300 billion of net new assets attracted
Outlook
- Confidence in medium-term outlook for markets
- Zero anxiety about hitting 30% margin