Regions Financial Corporation
CEO : Mr. John M. Turner Jr.
Quarterly earnings growth(YoY,%)
| Period | Revenue | Operating Income | EPS | Release Date |
|---|---|---|---|---|
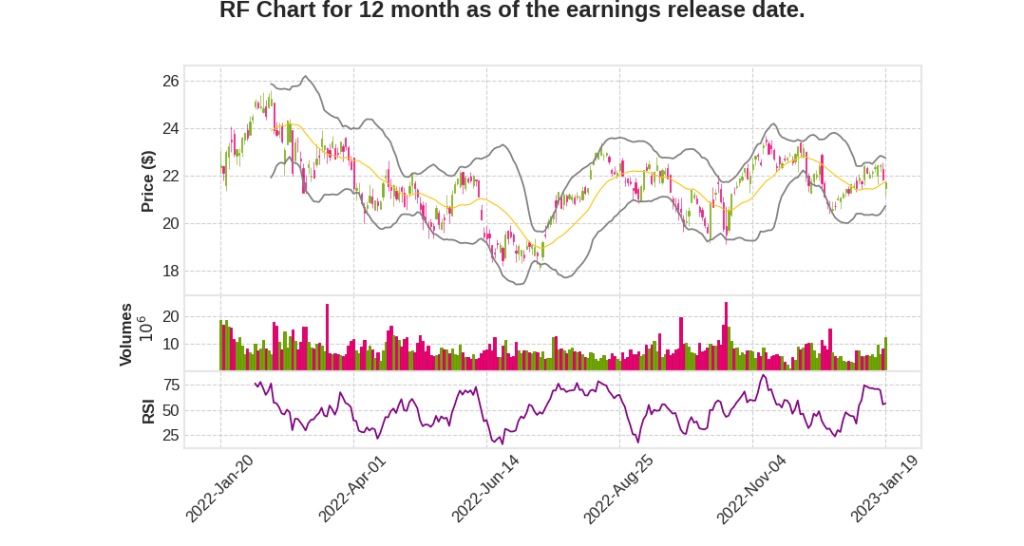
| 2022 Q4 | 19.6% YoY | 77.0% | 54.3% | 2023-01-20 |
David Turner says,
Loan Growth and Deposit Balances
- Average loans increased 1% sequentially or 9% year-over-year, with average business loans increasing 2% compared to the prior quarter.
- Average consumer loans declined 1% as growth in mortgage, Interbank and credit card was offset by the strategic sale of consumer loans.
- Ending deposit balances have declined approximately $7 billion year-over-year and are expected to decline further by $3 billion to $5 billion in the first half of 2023, reflecting continued Federal Reserve balance sheet normalization, seasonal trends and late-cycle rate-seeking behavior.
Net Interest Income and Margin
- Net interest income grew to a record $1.4 billion this quarter, representing an 11% increase while reported net interest margin increased 46 basis points to 3.99%, its highest level in the last 15 years.
- Growth in net interest income is expected to continue until the Federal Reserve reaches the end of its tightening cycle. Once the Fed pauses, deposit costs are expected to continue increasing for a couple of more quarters.
- The bank has constructed its balance sheet to support a net interest margin range of 3.6% to 4% over the coming years.
Adjusted Total Revenue and Noninterest Expense
- Adjusted noninterest income declined 9% from the prior quarter, with stability in wealth management income and a modest increase in card and ATM fees being offset by declines in other categories, mainly mortgage and capital markets.
- Salaries and benefits increased 2%, primarily due to an increase in associate headcount during the fourth quarter and higher benefits expense. Equipment and software expenses increased 4%, reflecting increased technology investments.
- The bank expects full-year 2023 adjusted total revenue to be up 8% to 10% compared to 2022, and full-year 2023 adjusted noninterest expenses to be up 4.5% to 5.5%, generating positive adjusted operating leverage of approximately 4%.
Asset Quality and Capital
- Overall credit performance remains broadly stable while experiencing expected normalization, with net charge-offs at 29 basis points in the quarter.
- Provision expense was $112 million this quarter, with the allowance for credit loss ratio remaining unchanged at 1.63%.
- The bank expects its full-year 2023 net charge-off ratio to be in the range of 25 to 35 basis points.
- The bank ended the quarter with a common equity Tier 1 ratio at an estimated 9.6%, reflecting solid capital generation through earnings, partially offset by continued loan growth.
- The bank plans to manage capital levels near the upper end of its 9.25% to 9.75% operating range over the near term given the uncertain economic outlook.
John Turner says,
Record Earnings and Revenue
- The company reported full year earnings of $2.1 billion, with record pretax pre-provision income of $3.1 billion.
- Adjusted positive operating leverage of 7% and industry-leading returns on both average tangible common equity and total shareholder return.
Successful Execution of Strategic Plan
- The company executed its strategic plan, growing revenue and average loans while prudently managing expenses.
- Investments in markets, technology, talent and capabilities diversified the revenue base and enhanced offerings to customers.
- Investments in treasury management products and services led to record revenue, while Wealth Management segment generated record revenue despite volatile market conditions.
Strong Position for 2023
- Business customers have strong balance sheets and continue to carry more liquidity than in the past.
- Deposit balances remain strong and credit card payments remain elevated for consumer customers.
- The job market is solid with approximately two open jobs available for each unemployed person across the Regions’ footprint.
- The company has a robust credit risk management framework, and a disciplined and dynamic approach to managing concentration risk.
Solid Balance Sheet and Liquidity Position
- The company has a strong balance sheet that’s well positioned to perform an array of economic conditions.
- The company has a solid capital and liquidity position to support balance sheet growth and strategic investments.
Uncertainty Ahead, but Confidence in Positioning
- The company acknowledges uncertainty ahead but feels good about how it’s positioned, with a solid strategic plan, an outstanding team, and a proven track record of successful execution.
Q & A sessions,
Deposits and Funding Mix
- Low loan deposit ratios
- Growing accounts for checking and operating accounts
- Expectation of deposit outflows of $3 billion to $5 billion in H1 2023
- No need for wholesale borrowings at least for H1 2023
- Ability to leverage strong deposit base for funding mix
Net Interest Income and Margin
- Net interest income grew to a record $1.4 billion in Q4 2022 representing an 11% increase
- Reported net interest margin increased 46 basis points to 3.99%, its highest level in the last 15 years
- Guidance for 2023 assumes a 35% full-cycle beta by year-end in the face of uncertainty regarding full cycle deposit betas for the industry
- Growth in net interest income is expected to continue until the Federal Reserve reaches the end of its tightening cycle
- Expected net interest income growth of 13% to 15% in 2023
Capital Allocation
- Capital to support loan growth
- Dividend payout in the range of 35% to 45%
- Use of capital for nonbank acquisitions to bolster noninterest revenue
- Share repurchases as the toggle to keep capital at upper end of 9.25% to 9.75% operating range
- Strong capital generation expected in 2023
Loan and Deposit Growth
- Ending loan growth of approximately 4% expected in 2023
- Deposit balances expected to decline further by $3 billion to $5 billion in H1 2023
- Stabilization of deposit balances expected midyear with potential for modest growth in H2 2023
Asset Quality
- Overall credit performance remains broadly stable while experiencing expected normalization
- Net charge-offs were 29 basis points in Q4 2022
- Full year 2023 net charge-off ratio expected to be in the range of 25 to 35 basis points
- Common equity Tier 1 ratio at an estimated 9.6%
- Plan to manage capital levels near the upper end of 9.25% to 9.75% operating range over the near term