Generac Holdings Inc.
CEO : Mr. Aaron P. Jagdfeld
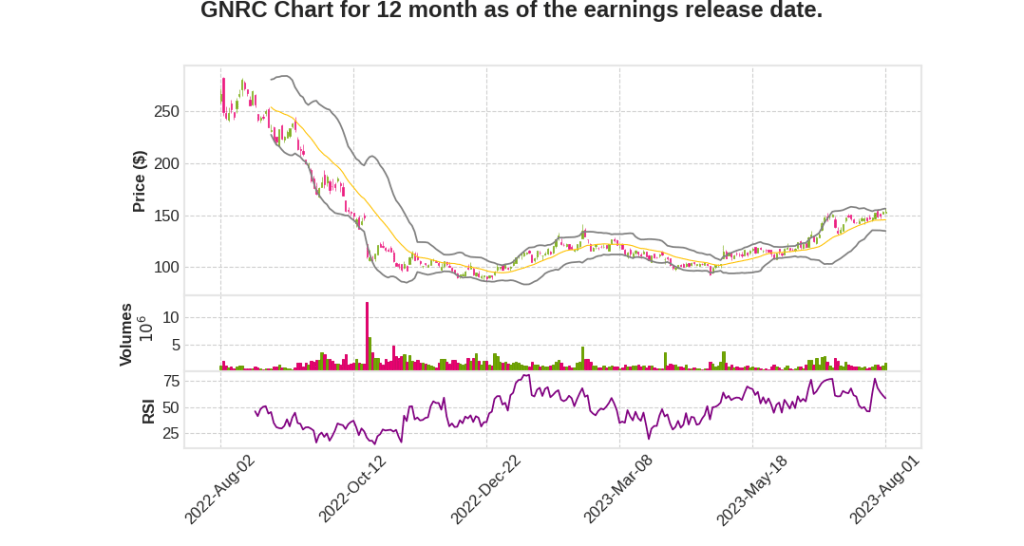
Quarterly earnings growth(YoY,%)
| Period | Revenue | Operating Income | EPS | Release Date |
|---|---|---|---|---|
| 2023 Q2 | -22.5% YoY | -60.4% | -68.8% | 2023-08-02 |
Aaron Jagdfeld says,
Net Sales and Core Sales
- Q2 net sales were in line with expectations.
- Overall net sales decreased 23% year-over-year.
- Core sales declined 26% during the quarter.
- Residential product sales decreased 44% compared to the strong prior year quarter.
- Global C&I product sales increased approximately 24% to an all-time quarterly record.
Adjusted EBITDA Margins
- Adjusted EBITDA margins were slightly lower than previously expected.
- Significant unfavorable sales mix and reduced operating leverage impacted margins.
- Favorable price cost dynamics provided a partial offset to the unfavorable sales mix.
Home Standby Generators
- Second quarter home standby shipments declined significantly year-over-year.
- Elevated levels of field inventory for home standby generators impacted shipments.
- Field inventory normalization process expected to extend into the second half of the year.
- Elevated field inventory levels to further impact home standby shipments in the second half.
- Return to year-over-year growth in home standby shipments anticipated in the fourth quarter.
Residential Energy Technology Products
- Power cell energy storage systems and ecobee sales grew at a strong rate sequentially.
- Suite of residential energy technology products and solutions expected to deliver gross sales at the low end of previous range.
- Weaker solar and storage industry demand dynamics expected to persist throughout the year.
C&I Products
- Global C&I product sales grew 24% to an all-time quarterly record.
- Shipments of natural gas generators for non-traditional applications saw tremendous growth.
- Domestic C&I product sales grew at a robust rate.
- C&I generators shipments and channel backlog increased.
York Ragen says,
Net Sales
- Net sales decreased 23% to $1 billion in Q2 2023 compared to $1.29 billion in the prior year Q2.
- Residential product sales declined 44% to $499 million, driven by lower shipments of home standby generators, power cell energy storage systems, and shore products.
- Commercial and industrial product sales increased 24% to $384 million, driven by broad-based growth across regions and channels, including domestic shipments, international shipments, and contributions from recent acquisitions.
- Other products and services sales increased 37% to $117 million, primarily due to the acquisition of electronic environments.
Gross Profit Margin
- Gross profit margin was 32.8% compared to 35.4% in the prior year Q2, primarily due to the unfavorable sales mix caused by the decline in home standby mix.
- Partially offset by previously implemented pricing actions and lower input costs.
Operating Expenses
- Operating expenses increased $2 million or 1% compared to Q2 2022, primarily driven by increased employee costs, higher marketing and promotion spend, and recurring operating expenses from recent acquisitions.
- Partially offset by lower variable operating expenses on lower sales volumes.
Adjusted EBITDA
- Adjusted EBITDA was $137 million or 13.6% of net sales in Q2 2023, compared to $271 million or 21% of net sales in the prior year.
- Lower EBITDA percent primarily driven by higher operating expenses as a percent of sales and lower gross margins.
Outlook for 2023
- Residential product sales for the full year 2023 expected to decline in the mid-20% range compared to the prior year.
- C&I product sales expected to grow at a mid-teens rate during the year.
- Overall net sales for the full year expected to decline between minus 10% to minus 12% compared to the prior year.
- Anticipate approximately 100 basis points of gross margin improvement over 2022 levels for the full year.
- Operating expenses as a percentage of net sales expected to be approximately 20% to 21% for the full year.
- Adjusted EBITDA margins before non-controlling interests expected to be approximately 15.5% to 16.5% for the full year.
Q & A sessions,
Field inventory levels
- The field inventory levels are expected to persist longer than originally anticipated.
- While field inventories are still higher than normal in some regions, there are regions where the inventory issue is no longer present.
Conversion rates and demand
- The close rate on sales leads is not growing at the expected rate, resulting in slower inventory clearance.
- It is unclear if the conversion delay is temporary or if it indicates a decrease in consumer willingness to make purchases.
- The company has established a nurturing team to re-engage with unclosed leads and stimulate demand.
Consumer spending environment
- Consumer spending on residential investment projects, such as home improvement projects, is expected to be softer.
- The Federal Reserve’s efforts to control inflation with higher rates may be impacting consumers’ willingness to make bigger ticket purchases.
- Close rates for these types of projects have flattened out and are not expected to improve further this year.
Normalization of channel recovery
- Dealers are expected to recover first, followed by wholesalers, and then retailers.
- Close rates are better the second time around when re-engaging with unclosed in-home consultation opportunities.
- The company’s efforts are focused on nurturing unclosed leads and improving close rates.
Field inventory normalization and market demand
- The company’s assumption of 1.0x field inventory as “normal” is based on pre-COVID levels around 2019.
- There may be a debate on what constitutes normal field inventory levels.
- Seasonal fluctuations in installation pace will affect the calculation of field inventory on a day’s adjusted basis.
- There is a risk that channel partners may perceive normal field inventory levels to be lower.