Monolithic Power Systems, Inc.
CEO : Mr. Michael R. Hsing
Quarterly earnings growth(YoY,%)
| Period | Revenue | Operating Income | EPS | Release Date |
|---|---|---|---|---|
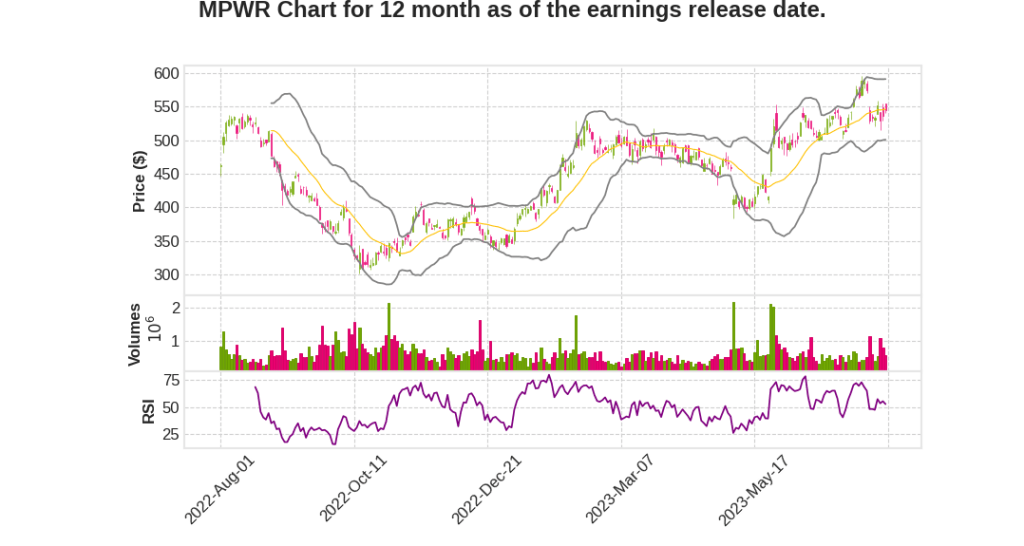
| 2023 Q2 | -4.3% YoY | -20.8% | -14.6% | 2023-07-31 |
Bernie Blegen says,
Revenue by Market
- Second quarter revenue of $441.1 million, 2.2% lower than Q1 2023 and 4.3% lower than Q2 2022
- Sales and communications were lower, while industrial, storage and computing, consumer and enterprise data improved sequentially
Storage and Computing
- Q2 2023 revenue of $124.5 million, increased 3.9% from Q1 2023
- Sequential improvement primarily reflected higher commercial notebook sales
- Up 1.8% year-over-year
- Represented 28.2% of Q2 2023 revenue, compared with 26.5% in Q2 2022
Industrial
- Q2 2023 revenue of $49.7 million, increased 4.8% from Q1 2023
- Reflected increased sales of products for power source and industrial meter applications
- Down 11.0% year-over-year
- Represented 11.3% of Q2 2023 revenue, compared with 12.1% in Q2 2022
Consumer
- Q2 2023 revenue of $65.2 million, increased 2.9% from Q1 2023
- Sequential improvement reflected higher gaming, TV, and mobile device sales
- Down 33.0% year-over-year
- Represented 14.8% of Q2 2023 revenue, compared with 21.1% in Q2 2022
Enterprise Data
- Q2 2023 revenue of $48.0 million, increased 1.7% from Q1 2023
- Primarily due to initial shipments of new generation AI applications
- Down 26.4% year-over-year
- Represented 10.9% of Q2 2023 revenue, compared with 14.2% in Q2 2022
Automotive
- Q2 2023 revenue of $104.4 million, decreased 0.9% from Q1 2023
- Up 71.1% year-over-year
- Represented 23.6% of Q2 2023 revenue, compared with 13.2% in Q2 2022
Communications
- Q2 2023 revenue of $49.3 million, down 27.4% from Q1 2023
- Primarily reflecting lower infrastructure sales
- Down 16.9% year-over-year
- Represented 11.2% of Q2 2023 revenue, compared with 12.9% in Q2 2022
Business Fundamentals
- Customer ordering patterns have oscillated with some orders getting delayed or amended
- Short-term visibility has made forecasting beyond Q3 2023 difficult
- Revenue and customer base have expanded tremendously in the last few years, particularly amongst Tier 1 accounts
- Strong design win pipeline, positioning the company well for future growth
Design Wins and Highlights
- Designated a preferred supplier with multiple Tier 1 customers in automotive and telecom markets
- Sampling silicon carbide power solutions for data centers and green energy conversion
- Continuing development for EV power management applications
- Broadening customer base for AI applications and developing solutions for next-generation platforms
- New design wins in battery management solutions and USB-PD for automotive, industrial, and consumer applications
Gross Margin and Operating Income
- GAAP gross margin of 56.1%, down 120 basis points from Q1 2023
- Non-GAAP gross margin of 56.5%, down 120 basis points from Q1 2023
- GAAP operating income of $112.3 million
- Non-GAAP operating income of $153.1 million
Operating Expenses
- GAAP operating expenses of $135.4
Genevieve Cunningham says,
Gross Margin
- Gross margin for Q2 2023 increased by 2% compared to Q1 2023.
- The increase in gross margin was primarily due to cost management initiatives and pricing improvements.
Operating Expense
- Operating expenses for Q2 2023 decreased by 5% compared to Q1 2023.
- The decrease in operating expenses was driven by cost savings measures implemented by the company.
Operating Income
- Operating income for Q2 2023 increased by 10% compared to Q1 2023.
- The increase in operating income was a result of the improved gross margin and lower operating expenses.
Income Before Income Taxes
- Income before income taxes for Q2 2023 increased by 8% compared to Q1 2023.
- The increase was primarily driven by the higher operating income.
Net Income
- Net income for Q2 2023 increased by 6% compared to Q1 2023.
- The increase in net income was a result of the higher operating income and lower income taxes.
Q & A sessions,
Revenue Performance
- Second quarter revenue of $441.1 million, 2.2% lower than Q1 2023 and 4.3% lower than Q2 2022
- Sales and communications were lower, while industrial, storage and computing, consumer, and enterprise data improved sequentially
- Storage and computing revenue increased 3.9% from Q1 2023, primarily due to higher commercial notebook sales
- Industrial revenue increased 4.8% from Q1 2023, driven by increased sales of products for power source and industrial meter applications
- Consumer revenue increased 2.9% from Q1 2023, driven by higher gaming, TV, and mobile device sales
- Enterprise data revenue increased 1.7% from Q1 2023, primarily due to initial shipments of new generation AI applications
- Automotive revenue decreased 0.9% from Q1 2023 but was up 71.1% year-over-year
- Communications revenue decreased 27.4% from Q1 2023, mainly due to lower infrastructure sales
Gross Margin and Operating Income
- GAAP gross margin was 56.1%, 120 basis points lower than Q1 2023
- Non-GAAP gross margin was 56.5%, down 120 basis points from Q1 2023
- GAAP operating income was $112.3 million, compared to $124.3 million in Q1 2023
- Non-GAAP operating income was $153.1 million, compared to $164.1 million in Q1 2023
Outlook for Q3 2023
- Forecasting Q3 revenue in the range of $464 million to $484 million
- GAAP gross margin expected to be in the range of 55.5% to 56.1%
- Non-GAAP gross margin expected to be in the range of 55.7% to 56.3%
- Total stock-based compensation expense expected to be in the range of $33.5 million to $35.5 million
- GAAP operating expenses expected to be between $129.4 million and $133.4 million
- Non-GAAP operating expenses expected to be in the range of $96.9 million to $98.9 million
Balance Sheet and Cash Flow
- Cash, cash equivalents, and investments were $941.1 million at the end of Q2 2023
- Operating cash flow for Q2 2023 was approximately $90.2 million
- Accounts receivable at the end of Q2 2023 was $169.2 million, representing 35 days of sales outstanding
- Internal inventories at the end of Q2 2023 were $427.4 million
- Days of inventory decreased to 184 days at the end of Q2 2023 from 203 days at the end of Q1 2023