Copart, Inc.
CEO : Mr. Jeffrey Liaw
Quarterly earnings growth(YoY,%)
| Period | Revenue | Operating Income | EPS | Release Date |
|---|---|---|---|---|
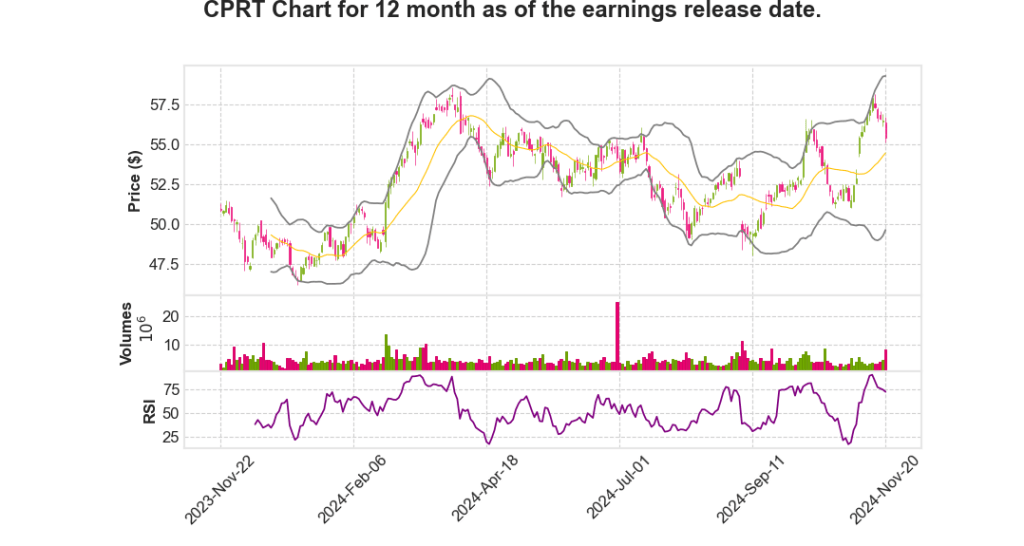
| 2025 Q1 | 12.4% YoY | 2.8% | 8.6% | 2024-11-21 |
Jeff Liaw says,
“`html
Storm Response and Impact
- Back-to-back hurricanes, Category 4 Hurricane Helene and Category 3 Hurricane Milton, hit Florida in late September and early October 2024, causing extensive damage.
- Copart’s advanced preparation resulted in picking up twice as many vehicles in the first 10 days compared to Hurricane Ian in 2022.
- By the end of October, Copart had sold approximately 25% of all assigned vehicles from both hurricanes.
- Three out of every four catastrophic units sold in Florida during October were transacted through Copart’s auction platform.
Insurance Business Growth
- Insurance business unit volume grew approximately 13% for the quarter.
- Excluding catastrophic events, year-over-year growth for the quarter was 9%.
- Total loss frequency for the quarter ending September 30 was 21.7%, an increase of almost 2% year-over-year.
Industry Trends and Long-term Outlook
- Population growth in the U.S. at 1% and vehicle miles traveled at 2% have contributed to long-term industry growth.
- Accident rates have shown a downward trend despite a slight increase from 2014-2018 due to smartphone proliferation.
- Total loss frequency has grown more than fourfold since 1990, driven by the complexity and cost of vehicle repairs.
- Copart anticipates ongoing organic industry growth over the next 5, 10, and 20 years.
Sustainability and Technological Integration
- Copart’s proactive storm preparation includes 2,000 acres of dedicated storage, with 1,000 acres for hurricane-prone areas.
- Deployment of real-time technology tools to optimize vehicle retrieval and movement.
- Industry-leading towing and transport network enables rapid response and recovery operations.
Secondary Market Dynamics
- Vehicles with complex safety technologies are more valuable in secondary markets like Eastern Europe and South America.
- Increasing insurance premiums have led to a higher share of uninsured or underinsured motorists.
- The long-term trend is toward more robust insurance coverage in the United States, with some cyclical variability.
Key Numbers and Dates:
| Event | Details |
|---|---|
| Catastrophic Vehicle Sales | 25% sold by end of October 2024 |
| Total Loss Frequency | 21.7% for quarter ending September 2024 |
| Insurance Business Growth | 13% unit volume increase |
“`
Leah Stearns says,
Quarterly Sales Trends
- Global unit sales and inventory increased by 12% and 6% respectively.
- U.S. unit growth was around 11%, with fee unit growth at 11% and purchase unit growth at nearly 6%.
- U.S. insurance unit volume increased by 12% year-over-year, with a 9% increase when excluding catastrophic (cat) units.
- International unit growth reached nearly 16%, boosted by severe floods in the UAE and Brazil.
Financial Performance
- Global revenue rose to $1.15 billion, marking a growth of over $126 million or approximately 12%.
- U.S. service revenue increased by 13%, while international service revenue growth was a robust 30%.
- Global gross profit was approximately $512 million, up by $48 million or about 10%.
- First quarter GAAP net income increased by about 9% to over $362 million or $0.37 per diluted share.
Cost Analysis
- Global facility-related costs increased by $88 million or about 22%.
- The company recognized $29 million in incremental costs due to Hurricanes Helene and Milton.
- International facility-related costs rose by $14 million, or nearly 24%, to support U.K. business expansion.
ASP and Margin Performance
- Global Average Selling Prices (ASPs) decreased by less than 1%, with a 1% decline in U.S. insurance ASPs.
- International ASPs increased by nearly 7%.
- U.S. gross profit increased to $448 million, although the gross margin decreased by 260 basis points to 47.2%.
Cash Flow and Capital Structure
- The company generated free cash flow of about $246 million.
- Total liquidity at the end of October was over $4.9 billion, comprising nearly $3.7 billion in cash.
- The firm benefitted from over $13 million in incremental interest income, with a tax rate of 20%.
Overall, the company’s solid quarter performance, with significant revenue and profit growth despite cost increases, positions it well for future expansion and could potentially positively influence its stock movement.
Q & A sessions,
Insurance Industry and Total Loss Practices
- Insurance carriers exhibit significant variation in total loss practices, influenced by regional and policyholder preferences.
- Some carriers utilize a statutory mindset, adhering to thresholds like a 75% damage-to-value ratio to determine total losses.
- Others apply individualized economic decisions considering repair costs, rental charges, and potential resale value at Copart auctions.
- Copart has developed tools to aid insurance carriers in making faster and better total loss decisions.
Impact of Hurricanes Helene and Milton
- Copart’s proactive storm preparation allowed the company to retrieve and sell vehicles quickly post-storm, selling 25% of assigned vehicles within three weeks.
- The company holds nearly 1,000 acres of storage capacity for storm-affected areas, facilitating rapid vehicle processing.
- Technology and logistics enhancements contributed to unprecedented speed in vehicle retrieval.
- 3 out of every 4 catastrophic units sold in Florida in October were sold on Copart’s platform.
Growth in Insurance Business and Total Loss Frequency
- Insurance business grew approximately 13% in unit volume for the quarter, excluding catastrophic events.
- Total loss frequency increased to 21.7%, a rise of nearly 2% year-over-year.
- Total loss frequency continues to be a major growth catalyst for Copart.
Long-term Industry Trends
- Population growth and vehicle miles traveled have outpaced accident reduction, supporting ongoing demand for Copart’s services.
- Accident rates have declined over decades, but total loss frequency has risen fourfold since 1990.
- Safety technologies, while reducing accident frequency, contribute to higher total loss frequency due to increased repair costs.
Financial Performance and Capital Structure
- Global revenue increased to $1.15 billion, representing 12% growth, primarily driven by volume increase.
- U.S. insurance ASPs showed resilience with a 1% decline year-over-year despite broader market drops.
- Free cash flow was approximately $246 million, with significant investments in land, logistics, and technology.
- Copart maintained strong liquidity with over $4.9 billion, including nearly $3.7 billion in cash.
| Metric | Q1 2025 | Change Year-over-Year |
|---|---|---|
| Global Revenue | $1.15 billion | 12% |
| Total Loss Frequency | 21.7% | +2% |
| U.S. Insurance ASPs | -1% | Resilient |
| Free Cash Flow | $246 million | N/A |