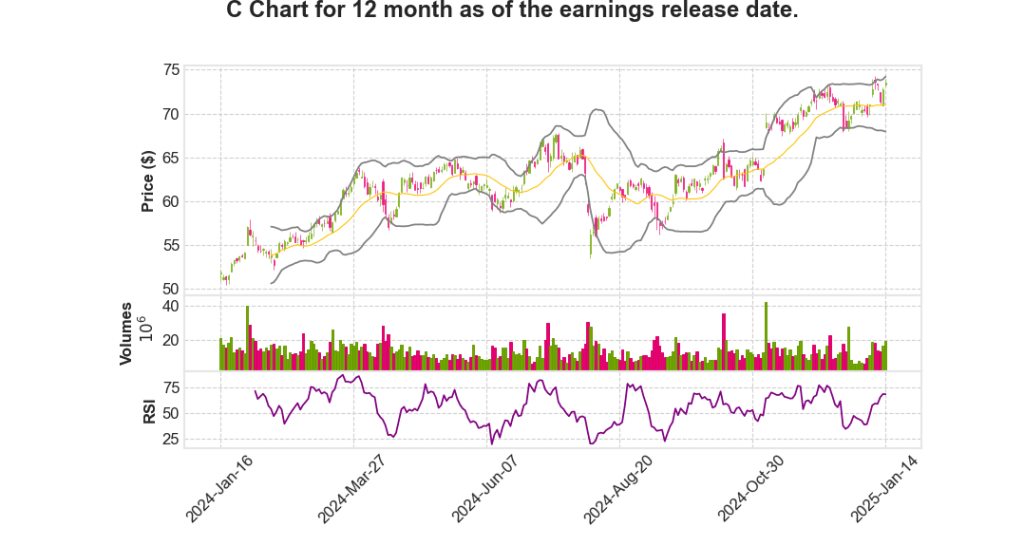
Citigroup Inc.
CEO : Ms. Jane Nind Fraser Ph.D.
Quarterly earnings growth(YoY,%)
| Period | Revenue | Operating Income | EPS | Release Date |
|---|---|---|---|---|
| 2024 Q3 | -1.4% YoY | -0.1% | -6.1% | 2025-01-15 |
Mark Mason says,
Financial Performance Overview
- The firm reported a net income of $2.9 billion for the fourth quarter, with an EPS of $1.34 and RoTCE of 6.1%.
- Total full-year revenues were $81.1 billion, marking a 5% increase driven by growth across all business segments.
- The company’s RoTCE for the year was 7% with a full year net income of $12.7 billion.
- Total markets revenues saw a significant increase of 36%.
- Expenses for the quarter were $13.2 billion, reflecting an 18% decrease due to the absence of the FDIC special assessment and restructuring charges.
Business Segment Performance
- Services revenues increased by 9% to $19.6 billion, while markets revenues increased 6% to $19.8 billion.
- Banking revenues saw a substantial 32% increase to $6.2 billion primarily due to a 42% growth in investment banking fees.
- Wealth revenues grew by 7% to $7.5 billion, driven by a 15% increase in non-interest revenue.
- U.S. Personal Banking revenues were up 6% as a result of growth in branded cards and retail services.
2025 and 2026 Guidance
- Projected revenues for 2025 are between $83.5 billion and $84.5 billion, indicating a 3% to 4% year-over-year growth.
- Expenses for 2025 are expected to be slightly lower than $53.8 billion due to organizational simplification and productivity savings.
- A RoTCE target range of 10% to 11% is set for 2026, with continued revenue growth and expense reduction.
- The firm plans to buy back $1.5 billion of common stock in the first quarter as part of its $20 billion share repurchase program.
Balance Sheet and Capital Management
- The balance sheet size decreased by 3%, mainly due to foreign exchange translation impacts.
- The company maintained a CET1 capital ratio of 13.6%, which is 150 basis points above the regulatory requirement.
- A total of $7 billion was returned to shareholders through dividends and share repurchases.
Key Strategic Investments
- $2.9 billion was spent on transformation initiatives, including infrastructure and platform modernization.
- Technology investments amounted to $11.8 billion, focusing on digital innovation and cybersecurity enhancements.
- Ongoing investments are planned to drive efficiency and enhance customer experience, particularly in data and digital capabilities.
Jane Fraser says,
Business Performance and Strategy
- Business Mix Change: The company successfully modified its business mix by increasing fee-based revenues.
- NIR Growth: Net Interest Revenue (NIR) for services grew by 37% this year, while wealth NIR increased by 15%, and IBCs by 35%.
- “Crown Jewel” Services: The services sector is highlighted as a core strength, showing growth, high returns, and market share gains.
- Strategic Execution: The strategic plan successfully positioned the company for global influence, with consistent achievement of revenue and expense targets.
Transformation and Compliance
- Progress in Compliance: Significant improvements have been made in risk, compliance, and accountability.
- Control Enhancements: Current exciting projects focus on enhancing business controls.
- Data Management: Identified as an area needing improvement, prompting a reassessment and expansion of efforts.
- Regulatory Expectations: Expanded scope to meet regulatory expectations, deemed essential for transformation success.
Future Outlook
- Long-Term Vision: The CEO emphasizes a commitment to long-term investment and competitiveness without sacrificing important investments.
- 2026 Target: The target year 2026 is described as a waypoint, not the final destination, indicating ongoing growth beyond this point.
Financial Highlights
| Segment | NIR Growth (%) |
|---|---|
| Services | 37% |
| Wealth | 15% |
| IBCs | 35% |
Key Decision and Implications
- Strategic Decision: The decision to expand transformation efforts was prioritized over short-term gains.
- Investment Philosophy: A firm stance against cutting long-term investments, preserving future competitiveness and growth.
Q & A sessions,
Share Buyback Program and Capital Strategy
- A buyback program of $20 billion has been announced, signaling confidence in earnings generation and addressing trading below book value.
- The buyback capacity has been increased to $1.5 billion to reflect momentum and confidence in the business.
- The CET1 target is set at 13.1%, and the company plans to manage capital actions accordingly to reach this target.
- The capital buffer of 100 basis points is being evaluated annually in line with regulatory changes.
- The CCAR stress test will influence the buyback strategy, impacting capital actions throughout the year.
Credit Losses and Provisions
- Net credit losses are expected to be at the high end of forecasts. Branded cards range is 3.5% to 4%, and retail services are 5.75% to 6.25%.
- Retail services are currently at 6.28%, and branded cards are at 3.64%, expected to approach 4% by year-end.
- Volume growth in USPB and macroeconomic factors such as unemployment and GDP are key drivers in the provisioning calculations.
- Provision models consider base, downside, and upside scenarios to align with broader macro factors.
Expense Management and Operational Efficiency
- Focus is placed on improving operating efficiency through consolidation and automation in technology and AI tools.
- Temporary elevation in expenses aims to support long-term investments and transformation.
- Emphasis on maintaining focus and discipline in expense management is a priority for the management team.
- The goal is to modernize the expense base align it with revenue generation, enhancing competitiveness.
Wealth Management Expansion
- Citi aims to become a global leader in wealth management, leveraging its $5.3 trillion in client assets.
- The firm is well-positioned to capitalize on wealth creation, particularly in Asia, the U.S., and the Middle East.
- Investment in talent acquisition and training is being prioritized to drive client experience and productivity.
- Q4 revenue in wealth management was up 20%, with a net new investment asset inflow of $42 billion, marking a 40% increase year-over-year.
U.S. Personal Banking Growth Strategy
- Top-line revenue growth, improved expenses, and a normalized credit environment are driving U.S. Personal Banking returns to mid-to-high teens.
- Strategic partnerships, like the one with American Airlines, enhance growth and returns in co-branded cards.
- Investments in innovation and simplified banking are fostering relationship-based banking in retail banking.
- The retail bank has transferred $17 billion of deposits to wealth, highlighting the synergy between segments.