U.S. Bancorp
CEO : Mr. Andrew J. Cecere
Quarterly earnings growth(YoY,%)
| Period | Revenue | Operating Income | EPS | Release Date |
|---|---|---|---|---|
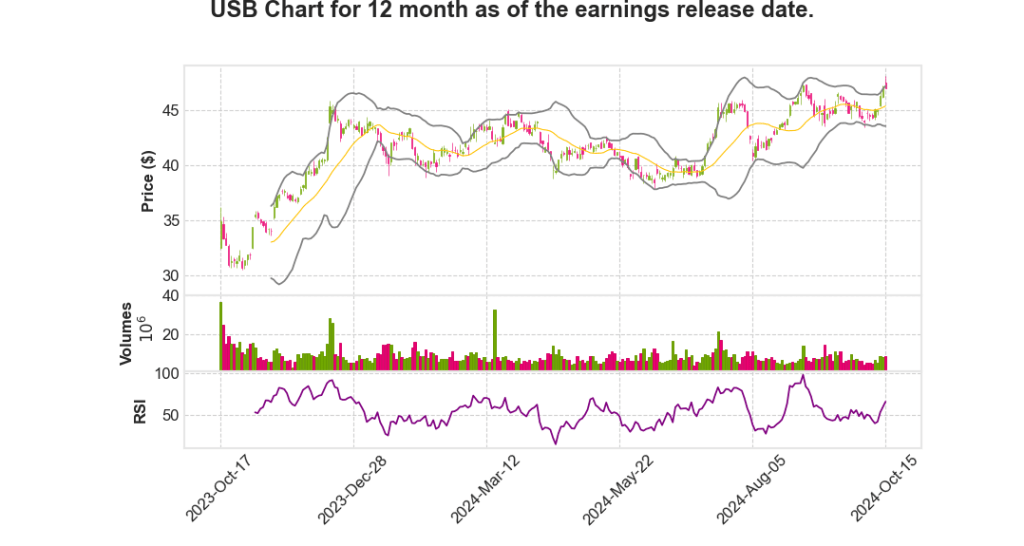
| 2024 Q3 | -10.3% YoY | 4.8% | 13.2% | 2024-10-16 |
John Stern says,
Balance Sheet Overview
- Total average deposits decreased by 1.0% on a linked quarter basis to $509 billion due to prioritizing relationship-based deposits and maintaining pricing discipline.
- Average loans decreased modestly by 0.2% on a linked quarter basis to $374 billion, with declines in commercial balances due to capital market-related paydowns.
- Investment portfolio’s ending balance slightly declined to $167 billion with an average yield for the quarter of 3.20%.
Credit Quality and Loan Loss Provision
- Exposure to commercial real estate office portfolio reduced, with reserves at 10.8%.
- Non-performing assets ratio remained unchanged at 0.49% linked quarter versus 0.35% year-over-year.
- Net charge-off ratio increased slightly to 0.60% from 0.58% in Q2, aligning with expectations.
- Allowance for credit losses totaled $7.9 billion or 2.1% of period-end loans.
Third Quarter Earnings Performance
- Earnings per diluted share were reported at $1.03, including $189 million after-tax net losses from investment portfolio rebalancing.
- Net interest income was approximately $4.17 billion, up 2.8% linked quarter, with net interest margin growth of 7 basis points to 2.74%.
- Non-interest income was $2.7 billion, with core business offerings showing year-over-year growth despite $119 million net security losses.
Expense Management and Capital Position
- Non-interest expense for the quarter was stable at $4.2 billion, declining 1.0% year-over-year, driven by operational efficiencies.
- Common equity Tier 1 ratio increased to 10.5% as of September 30th, up 20 basis points from Q2.
- Company plans a modest share repurchase in the near term as part of capital distribution strategy.
Forward-Looking Guidance
- Fourth quarter net interest income is expected to hold steady relative to the current quarter’s $4.17 billion.
- Full-year 2024 net interest income projected at the higher end of the $16.1 billion to $16.4 billion range.
- Mid-single-digit growth in total non-interest income is anticipated for the full year, likely at the lower end of the expected range.
- Non-interest expense as adjusted is expected to be $16.8 billion for the full-year 2024.
Andy Cecere says,
Earnings and Financial Performance
- Reported diluted earnings per share (EPS) of $1.03 for Q3 2024.
- Total net revenue was $6.9 billion.
- Return on tangible common equity reached 17.9%.
- Tangible book value per share increased to $24.71, a 6.7% improvement from last quarter and 18.5% higher year-over-year.
Revenue and Interest Income
- Net interest margin expanded by 7 basis points to 2.74%.
- Growth driven by improved spread income, favorable loan mix, and strategic actions on the investment securities portfolio.
- Efficiency ratio improved to 60.2%.
Capital and Asset Quality
- Common equity Tier 1 capital ratio increased by 20 basis points from last quarter to 10.5%.
- Non-performing assets, net charge-off ratio, and late-stage delinquency metrics remained stable compared with the second quarter.
Fee Business and Market Growth
- Achieved year-over-year double-digit revenue growth in commercial and investment products due to capital markets activity and wallet share gains.
- Notable growth in trust and investment management, payment services, mortgage banking, and treasury management fee revenues.
- Growth supported by improved market conditions, deepening client relationships, and expanded product and distribution channels.
Q & A sessions,
Financial Performance Highlights
- The third quarter reported diluted earnings per share of $1.03.
- Total net revenue reached $6.9 billion, driven by strong growth in net interest income and fee business initiatives.
- Return on tangible common equity was 17.9%.
- Tangible book value per share increased to $24.71, marking a 6.7% improvement from the previous quarter and an 18.5% increase year-over-year.
Balance Sheet Overview
- Total average deposits decreased by 1.0% linked quarter to $509 billion.
- Average loans were slightly down by 0.2% linked quarter, totaling $374 billion.
- Investment portfolio ending balance slightly declined to $167 billion with an average yield of 3.20%.
- Common equity Tier 1 capital ratio rose to 10.5%, up by 20 basis points from the previous quarter.
Asset Quality and Credit Performance
- Non-performing assets and late-stage delinquency metrics remained stable compared to the previous quarter.
- Net charge-off ratio increased slightly by 2 basis points to 0.60%.
- Allowance for credit losses totaled $7.9 billion, representing 2.1% of period-end loans.
- Commercial real estate office portfolio exposure slightly reduced and was appropriately reserved at 10.8%.
Guidance and Forward-Looking Statements
- Net interest income for Q4 is expected to be stable compared to Q3’s $4.17 billion.
- Full-year 2024 net interest income is projected to be at the higher end of the $16.1 billion to $16.4 billion range.
- Mid-single-digit growth in total non-interest income is expected for the full year, albeit at the lower end of the range.
- Full-year non-interest expense, as adjusted, is anticipated to be $16.8 billion.
Strategic Initiatives and Operational Efficiency
- The company anticipates positive operating leverage expansion into Q4 2024 and 2025.
- Investments in digital capabilities and technology modernization are driving future scalability and efficiency.
- Emphasis on relationship-based deposits and disciplined liability management continues to be a priority.
- Planned modest share repurchase in the near-term as part of capital distribution strategy.
| Metric | Q3 2024 |
|---|---|
| Diluted EPS | $1.03 |
| Net Revenue | $6.9 billion |
| Return on Tangible Common Equity | 17.9% |
| Common Equity Tier 1 Ratio | 10.5% |
| Tangible Book Value per Share | $24.71 |